Мы с важной новостью: с 28 февраля 2025 года сервис Хабр Фриланс прекратит свою работу.
Купить услуги можно до 28 февраля 2025, но пополнить баланс уже нельзя. Если на вашем счете остались средства, вы можете потратить их на небольшие услуги — служба поддержки готова поделиться бонусами, на случай, если средств немного не хватает.

Power BI, Business Analysis
Sales and Traffic Dashboard
Добавлено
30 янв 2023 в 18:12
Поделиться
Dashboard link
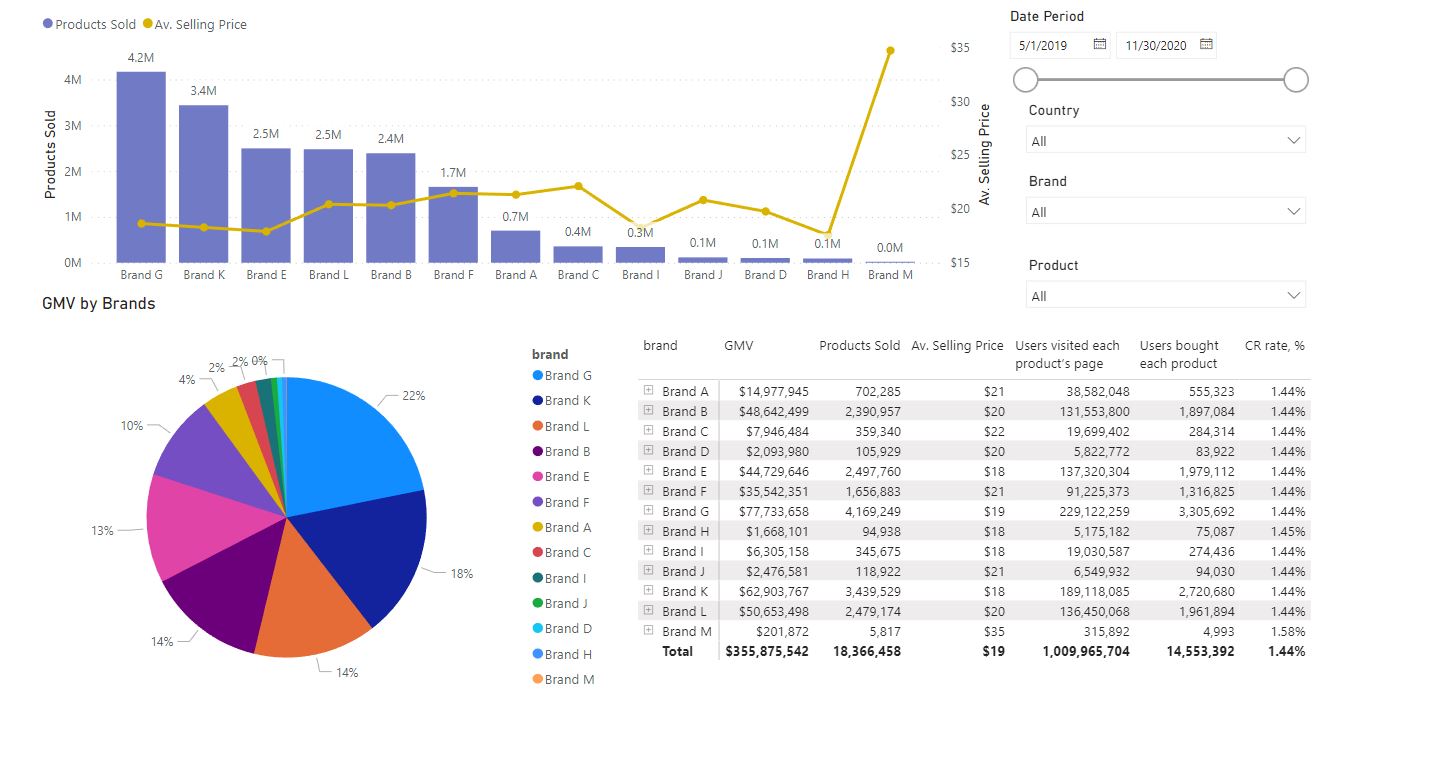
Client requested a new report that will show information of:
Sales Analytics:
GMV : This is the Gross Merchanside Value or The Total Sales Generated (in USD)
Products Sold
Average Selling Price: Derives from the following division: GMV / Products Sold
Traffic Analytics:
Total Users who visited each product’s page
Total users who bought each product
Conversion Rate: (Total users who bought each product) / (Total Users who visited each product)
Example of Business questions:
1) How we can monitor the dynamics of GMV by month?
2) When was the highest value of CR?
3) How is the GMV shared by countries, channels and brands?
4) What is the most popular brand and product amongst visitors and buyers?
5) Which country has the highest Selling price for Brand E?
Data model

Selected data sample consists of two fact tables – traffic and sales. To create relations between them properly it’s better to create separated dimension tables – Product, Channel, Brand, Country and Calendar (as date table). Also, we can create them via DAX but in this case, we could have a problem with large data model size and low model performance in future. Then we can connect two tables based on snowflake scheme.
Client requested a new report that will show information of:
Sales Analytics:
GMV : This is the Gross Merchanside Value or The Total Sales Generated (in USD)
Products Sold
Average Selling Price: Derives from the following division: GMV / Products Sold
Traffic Analytics:
Total Users who visited each product’s page
Total users who bought each product
Conversion Rate: (Total users who bought each product) / (Total Users who visited each product)
Example of Business questions:
1) How we can monitor the dynamics of GMV by month?
2) When was the highest value of CR?
3) How is the GMV shared by countries, channels and brands?
4) What is the most popular brand and product amongst visitors and buyers?
5) Which country has the highest Selling price for Brand E?
Data model
Selected data sample consists of two fact tables – traffic and sales. To create relations between them properly it’s better to create separated dimension tables – Product, Channel, Brand, Country and Calendar (as date table). Also, we can create them via DAX but in this case, we could have a problem with large data model size and low model performance in future. Then we can connect two tables based on snowflake scheme.